This web page was produced as an assignment for Genetics 677, an undergraduate course at UW-Madison.
Gene Expression
Figure 1: Graph shows induction or repression of genes under either androgen sensitive (AS) or androgen insensitive (AI) conditions within prostate cancer cell lines. In order to see more information, please select the image.
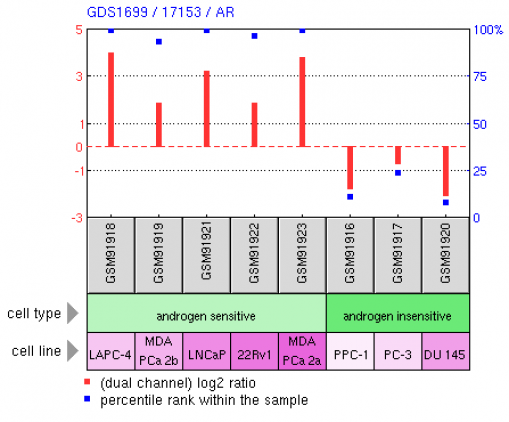
Because of the small amount of subjects used, I cannot use osprey. It appears from figure 1 that androgen sensitive prostate cancer lines upregulate other genes. Androgen insensitive prostate cancer seemed to down regulate other genes. This result suggest a way of distinguishing the two types of cancer. This result suggests that cancers with androgen sensitivity may have different drug target candidates than androgen insensitive prosate cancer lines.
Figure 2: Graph shows expression induction or repression for several genes. The first five columns come from androgen sensitive (AS) prostate cancer cell lines; the final three columns come from androgen insensitive (AI) prostate cancer cell lines. Notice the difference in gene expression between androgen sensitive and androgen insensitive prostate cancer lines.
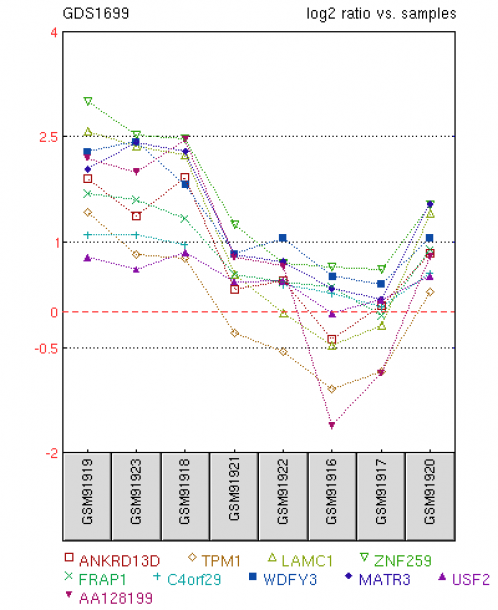
There appears to be a difference in gene expression between the two groups AS and AI with more induction with AS prostate cancer cell lines. This assertion is excepting USF2, which appears to have little difference between the two groups. ZNF259 appears to be the most upregulated in AS as opposed to AI cell lines. ZNF259 regulates cell proliferation. LAMC1 is involved with cell adhesion, cell differentiation, and metastasis. It is also greatly upregulated in AS prostate cancer cell lines. Another interesting gene expression difference is with FRAP1, which regulates cellular responses to DNA damage. These genes may be a target for AS prostate cancer cell lines as opposed to AI prostate cancer cell lines.
Website authored by Sam Trammell. Email: [email protected]. Last updated: April 28, 2009.
